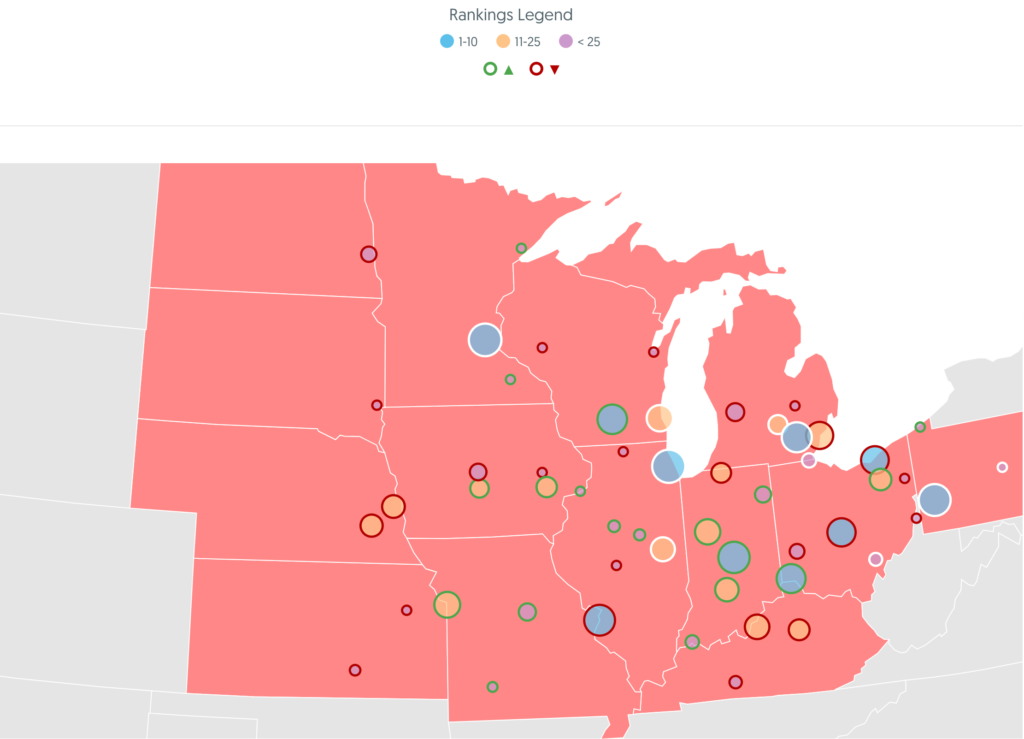

There is a lot of value in benchmarking studies and the insights they provide. As a bunch of data-hungry analysts, we geek out looking at the methodology and sources when reports and studies are published. M25, a venture capital firm based in Chicago, recently published its Best of the Midwest: Startup Cities Rankings and because they have even invested in three companies that have come through our entrepreneurial services and incubator program, we were really interested in looking at how they measure entrepreneurship and how they view the startup ecosystem.
Before we dig in — we want to emphasize that we respect the
amount of work reports like this require and you’ll never satisfy your entire
audience. Case-in-point, when we peeked behind the curtain there were a few
things that stood out to us as potentially adding bias to the results.
Here’s what we found.
Population
We don’t have to dig too deep to see one of the most obvious
limitations of this analysis – population disparity. While the M25 study
acknowledges that Chicago has the largest population, it doesn’t acknowledge that
one of the 24 underlying variables is actually population. This means that
larger communities are going to inherently benefit in this methodology.
Next, when examining the study’s underlying
variables, we noticed only a few are controlled for population. This means that
the larger metropolitan regions have larger pools from which to pull their
numbers. According to the underlying
variables ranking index[1],
only startup density (number of startups per population) and educated workforce
were adjusted for population. Fun fact: Ann Arbor is first in both of these
rankings.
“Ann Arbor has created a vibrant, compact tech ecosystem centered around the world-class University of Michigan, leading to the highest startup density in our rankings …”
Key takeaways excerpt from M25 “2019 Best of the Midwest: Startup Cities Rankings”
Considering the significant disparity between Ann Arbor’s population and the metropolitan areas listed in the top five, it’s really quite remarkable that Ann Arbor ranked as high as it did. We believe this is indicative of the strong entrepreneurial culture being fostered here by Ann Arbor SPARK, Ann Arbor/Ypsilanti SmartZone Local Development Finance Authority (LDFA), the University of Michigan, Cahoots, the Michigan Economic Development Corporation, and other businesses who believe in the value of innovation.
Metropolitan Area Populations
Chicago: 9.5 million
Minneapolis: 3.6 million
Pittsburgh: 2.3 million
Indianapolis: 2.0 million
St. Louis: 2.8 million
Ann Arbor: 371,000
Metropolitan Statistical Areas
Similar to the issue
with population, the M25 study uses metropolitan statistical areas (MSAs) to
define the boundaries of a city. For Ann Arbor, that means Washtenaw County
which is 722 square miles. Chicago’s
MSA is 10,857 square miles and includes parts of Wisconsin, Indiana, and
Illinois. This significantly increases the number of resources and
municipalities that influence variables such as number of government programs
and population reach (the population within a 125-mile radius and number of
interstate highways).
For comparison, this is what a 10,000 square miles radius
Ann Arbor would look like:

Detroit and Ann Arbor are Allies
In the report’s key findings, M25 concludes that Detroit is
“losing” to Ann Arbor which implies one region cannibalizes the other’s
economic development growth. Here is a great example of how rankings fall short
of telling the real story — one that is rich in collaboration, support, and
shared goals. There are a number of Ann Arbor-based startups that have a
presence in Detroit. One great example of this is May Mobility which is based
in Ann Arbor and deployed its driverless shuttles in Detroit. In 2018, Duo
Security opened a Detroit office. Google has offices in both Ann Arbor and
Detroit. Ford Motor Company recently announced its City
Insights Platform at its Ann Arbor-based FordLabs.
Proven Startup Culture
Regardless of our scrutiny, the M25 rankings clearly
identify a significant amount of startup activity happening in the Midwest. There
are definitely multiple regions excelling and it would be interesting to see a
year-over-year analysis for these communities. Together, we’ve been able to
shrug off the Midwest flyover mentality, we’re attracting venture capital from
the coasts, and our ecosystems are thriving. We don’t have to compete with each
other when together, the Midwest competes on a global stage.
Conclusion
While we acknowledge that there is no prescribed, perfect way of comparing regions’ startup activity, we invite you to check out our attempt, the Ann Arbor SPARK benchmarking study, that compares the Ann Arbor region’s economic competitiveness to 12 other regions, the State of Michigan, and national averages using eight different metrics.
[1]
Note: The spreadsheet that includes “all
2019 rankings data” is not raw data, but more rankings broken down by
individual variables.
The post Startup Cities Rankings: An Analysis of the Methodology appeared first on Ann Arbor SPARK.
Source: SPARK